
[This article was originally published by wonkHE.]
The 2021 UCAS June deadline applicant figures confirmed the surging demand for university from 18 year olds, underscoring concerns about whether there is enough university capacity to meet it. New data on 2021 offers gives the first temperature check on this.
It shows the supply-demand balance clearly shifting against applicants, with a reduction in offer rates and applicant choice for the first time since 2012. The pressure this year is concentrated on higher tariff providers. Here, despite efforts to reduce the impact, under-represented applicants have still seen rejections increase sharply. With demand looking strong for the 2020s these patterns could well be a foretaste of much less favourable world for applicants, and one where it gets harder for universities to increase access for under-represented groups.
A chill wind for applicants?
The new UCAS offer data , whilst extremely welcome, is somewhat scant in comparison to the detailed application data. The dimensions are limited (we cannot look at Scotland or Northern Ireland separately on most measures, for instance, or look at sex or ethnic group at all). And the time-series is very short, just five years.
We have combined these new offer data with similar data in the standard and equality releases to, with a few adjustments, get a long-term time series. There have been a few changes over this period (reducing the maximum choices from six to five in 2008, changes relating to Art and Design and Nursing coverage). But when looking at applications from 18-year-olds, particularly over the past decade or so, it will give a reliable strategic signal.
Figure 1 Offer rates to UK 18-year-old applications

Figure 1 shows offer rates to UK 18-year-old applications over this extended period. Offer rates were lower when tight number controls met high demand (2011 in particular). After 2012 progressively more places were released from controls (though not in Northern Ireland and Scotland) and universities could offer more without fear of being fined for over-recruitment. At the same time demographic and other factors contributed to broadly flat applicant numbers. The supply-demand balance moved decisively in favour of applicants, and they became more and more likely to get offers, from all types of providers, and to get placed. In 2020 the offer rate pushed over 79%, a new high that followed nine consecutive years of growth.
But 2021 has changed that trend. The offer rate has fallen by around 1 percentage point, representing the first contraction in choice in offers of the post-2012 world. Whilst a significant signal of a changing environment on its own, this overall figure hides the severity of the switch at higher tariff providers (those with the highest entry grades amongst there students, typically Russell Group or similar). Here the chance of securing an offer has collapsed by 5 percentage points from 74% to 69%, back to a level last seen in 2013.
Why this move is important to how the system feels to applicants is best shown by flipping the statistic we are looking at to give a rejection rate (Figure 2). For higher tariff providers this has surged, making applications (proportionally) 20 per cent more likely to be rejected. This is a large move, likely large enough to be felt by applicants, parents, and teachers.
Figure 2 Rejection rates to UK 18-year-old applications

The rejection rate might be the better measure here because it directly measures the sense of being thwarted in aspiration that credibly drives the political pressure around university places. The exam crisis last year was mostly a university-entry crisis, in that the anger of grades was usually expressed in terms of the university place they believed they would otherwise had got. Similarly, the policy drive to uncap places in the 2012 reforms was informed by several miserable cycles for young people, typified by tearful students on results days, where both offer rates and placed rates sank.
Is 2021 a special case or a preview of the future?
There are some specific factors for this cycle. Higher tariff providers took in additional students to resolve the “exam crisis” last year. With that enlarged intake still in the system, and a further increase in applications this year, some will be nearing their maximum capacity both in terms of physical estate and teaching staff. The effect of the being near the limit is amplified by the uncertainty over grades this year. Selective providers often control their recruitment by rejecting those who do not meet their conditions at results. The off-the-scale increase in grades last year drove a coach and horses through this normally finely balanced process. With good reason to expect further grade increases this year, some universities will have been forced to be conservative on offers to control the uncertainty.
Even with the increase this year, we are still a long way from the rejection rates common pre-2012. And choice is being reduced, rather than eliminated: offer rates at lower tariff providers are still increasing. But applicant demand looks exceptionally strong for the next decade. The jump to higher grades (and the university aspirations that come with them) might well turn out to be permanent. Although some of the effects on the offer rate this year might be one-offs, they could well be giving a preview of where university admissions are going over the next few years.
The balmy climate of ever-increasing choice for applicants that has characterised the past decade certainly looks under threat. The sharp reduction in higher tariff offer rates might well be the first chill wind of a much less favourable supply-demand world for applicants. The desire of young people to improve their education through going to university is a strong and extremely durable long-term trend. Governments might want to be mindful of the political pressures that can rapidly build up if the supply of places does not keep up with aspiring demand.
An early warning on university access?
The rising rejection rates from higher tariff providers have not affected all applicants equally. Figure 3 shows rejection rates from for applications from different neighbourhoods (using the POLAR4 grouping, group 1 has the lowest entry rate to higher education, group 5 the highest).
Figure 3 Higher tariff provider rejection rates by POLAR4

Rejection rates have been neatly ordered by POLAR group over the past decade. Not generally because of differential treatment by providers, but because the strength of the application (for example, predicted grades) vary across these groups. Rejection rates for all groups become lower in the post-2012 world. In recent years it seems to have been the more under-represented Q1 and Q2 groups that have seen their rejection rates fall, likely reflecting widening access policies.
In 2021 rejection rates increased for everyone, but not by the same amount. The rejection rate for Q1 increased by 2.5 percentage points, less than half the 5.5 percentage point increase seen by Q5. This suggests higher tariff providers are trying to prioritise dwindling growth capacity for under-represented groups. Nevertheless, the rejection rate for Q1 had been on a downward trend, and so it now perhaps 3.5 points higher than you might otherwise have expected. The squeeze on places might be hurting Q1 less that others, but it is still making access harder for them.
Applicants from Q2, which are also under-represented at higher tariff providers (Q1 has around 22% of the entry rate of Q5, Q2 has around 33%) do not seem to have enjoyed as much protection. Their rejection rates have jumped by almost four percentage points and are now marginally higher than those from Q1 for the first time.
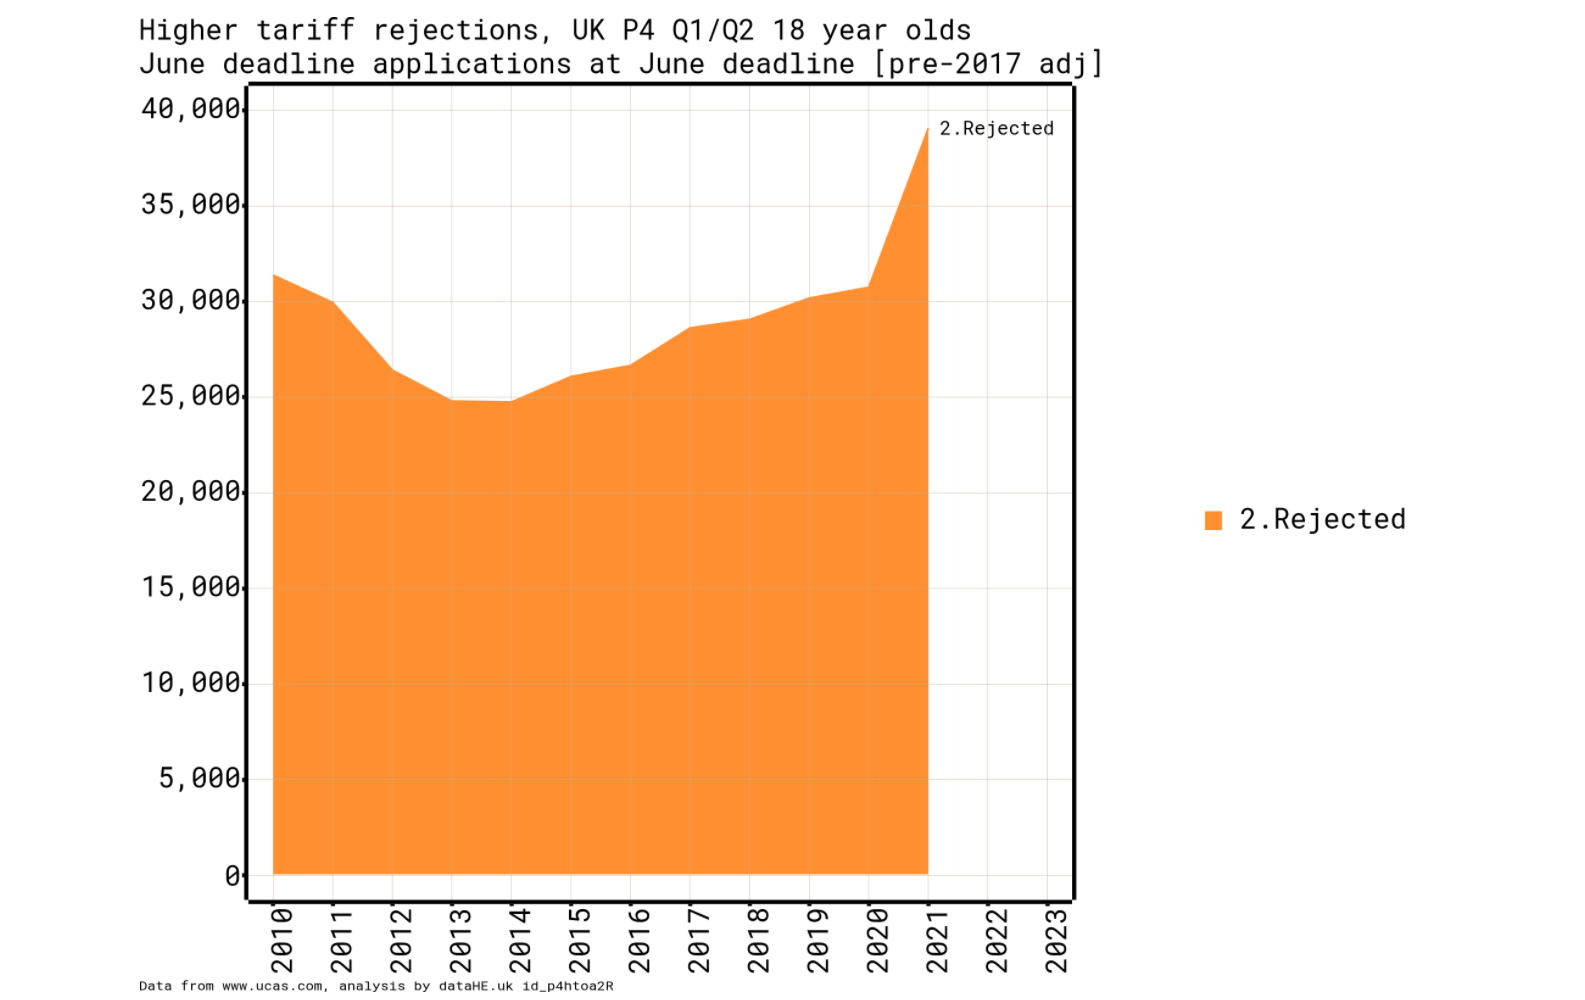
Figure 4 POLAR4 Q1/Q2 UK 18-year-old applications to higher tariff providers

Figure 4 shows what these patterns mean in terms of actual applications, taking the POLAR Q1 and Q2 groups together as those severely under-represented in higher tariff providers. Applications from these under-represented applicants have increased by 35,000, from 70,000 (2011) to 105,000 (2020). And higher tariff providers responded in full to this increased demand, with offers rising 35,000 from 40,000 (2011) to 75,000 (2020). That pattern breaks in 2020. Applications increasing 15,000 to 120,000 but – with pressure on places – offers only crept up 5,000 or so. Most of the ‘extra’ Q1/Q2 applications where rejected.
The result is a jump of over 8,000 in rejected applications from these under-represented groups, a proportional increase of over a quarter. Q1/Q2 rejections now total 39,000 (Figure 5), the highest number ever recorded. How this will play out for the entry chances of actual applicants (instead of applications) is unknown at this point. But it is likely that the increase in rejections will lead to the number of Q1/Q2 students gaining access to these universities being less than would otherwise has been the case.
Figure 5 POLAR4 Q1/Q2 UK 18-year-old rejections from higher tariff providers

Anyone who works in higher education will know of the extensive efforts made by universities, charities, and governments to improve the very low entry rates of under-represented groups to higher tariff universities. A lot of this effort goes into encouraging and preparing these applicants to risk an application to one of these selective universities. That more than ever of those who do apply have been rejected this year is wasteful of those efforts and may make it harder to encourage people to apply in the future.
Despite some compensating action by universities, pressure on places can only make improving access harder. The warm glow of generally improving access measures that governments have enjoyed for some time cannot be relied upon in the 2020s. It is another reason for governments to consider whether they are doing enough to support university capacity for UK demand over the next decade.
[Reference tables for figures.]
Table 1 Rejection rates to UK 18-year-old applications by provider tariff group (from Figure 2)
| Year | 0: All | 1: Higher | 2: Medium | 3: Lower |
|---|---|---|---|---|
| 2006 | 26.6% | 35.1% | 21.5% | 20.3% |
| 2007 | 26.9% | 35.0% | 21.5% | 21.3% |
| 2008 | 25.5% | 33.4% | 20.3% | 20.0% |
| 2009 | 26.6% | 34.6% | 21.5% | 21.4% |
| 2010 | 30.4% | 37.8% | 25.9% | 26.2% |
| 2011 | 32.3% | 38.2% | 29.6% | 29.1% |
| 2012 | 29.2% | 33.6% | 26.4% | 27.3% |
| 2013 | 25.7% | 30.9% | 23.2% | 22.4% |
| 2014 | 24.4% | 28.4% | 22.6% | 21.7% |
| 2015 | 23.7% | 27.0% | 22.8% | 20.8% |
| 2016 | 23.2% | 26.8% | 21.8% | 20.2% |
| 2017 | 22.0% | 26.4% | 19.8% | 18.5% |
| 2018 | 21.3% | 26.9% | 17.9% | 17.2% |
| 2019 | 21.0% | 26.9% | 17.3% | 16.7% |
| 2020 | 20.6% | 26.6% | 17.3% | 15.6% |
| 2021 | 22.2% | 31.5% | 17.6% | 13.8% |
Table 2 Rejection rates to UK 18-year-old applications to higher tariff providers by POLAR4 quintile (from Figure 3)
| Year | 1 | 2 | 3 | 4 | 5 |
|---|---|---|---|---|---|
| 2010 | 43.3% | 40.4% | 39.6% | 38.1% | 35.5% |
| 2011 | 44.0% | 41.7% | 40.3% | 38.5% | 35.7% |
| 2012 | 39.9% | 37.0% | 36.0% | 34.1% | 31.0% |
| 2013 | 36.0% | 33.7% | 32.7% | 31.7% | 28.5% |
| 2014 | 33.9% | 30.9% | 30.3% | 28.9% | 26.1% |
| 2015 | 32.7% | 30.2% | 28.8% | 27.3% | 24.4% |
| 2016 | 32.4% | 29.6% | 28.5% | 27.6% | 24.2% |
| 2017 | 31.4% | 29.4% | 28.4% | 27.0% | 23.8% |
| 2018 | 31.9% | 30.0% | 28.6% | 27.5% | 24.4% |
| 2019 | 31.1% | 29.4% | 29.1% | 27.7% | 24.1% |
| 2020 | 29.8% | 28.7% | 28.7% | 27.2% | 24.3% |
| 2021 | 32.3% | 32.5% | 33.5% | 32.5% | 29.8% |
Table 3 Applications, offers and rejections: UK 18-year-old POLAR4 Q1/Q2 applications to higher tariff providers (from Figure 4)
| Year | Applications | 1.Offered | 2.Rejected |
|---|---|---|---|
| 2010 | 75,740 | 44,360 | 31,380 |
| 2011 | 70,480 | 40,530 | 29,950 |
| 2012 | 69,460 | 43,050 | 26,410 |
| 2013 | 71,760 | 46,970 | 24,790 |
| 2014 | 77,290 | 52,540 | 24,750 |
| 2015 | 83,740 | 57,660 | 26,080 |
| 2016 | 87,020 | 60,370 | 26,650 |
| 2017 | 94,920 | 66,300 | 28,620 |
| 2018 | 94,580 | 65,520 | 29,060 |
| 2019 | 100,270 | 70,090 | 30,180 |
| 2020 | 105,410 | 74,670 | 30,740 |
| 2021 | 120,470 | 81,410 | 39,060 |