
Government statements on exam grading in England for 2023 have been helpful and clear, being most recently summarised here. The message seems unequivocal. The grade distribution is going back to pre-pandemic norms, 2019 the indicated comparison point, with some protections to stop any pandemic learning impairment from dragging the distribution down below the 2019 level.
Admissions of UK 18-year-olds from conditional offers against yet-to-be-awarded grades is a finely calibrated process that is difficult to manage when grade distributions move a great deal. In both 2020 and 2021 awarded grades were higher than universities had expected and, by honouring the offers already made, some selective universities took in far more than they had planned for. When grades go down universities have a different problem, ahead of results, to decide if the grades an applicant has got are good enough for course, without knowing if weak grades mean a weak applicant or simply reflect a national profile of grades that has shifted sharply lower that year. For applicants it is simpler, higher grades overall than expected are good for their chances of getting in, lower grades than expected leaves them more dependent on universities.
To see what might happen in 2023 we have taken Ofqual’s statements for England at face-value (and, with England dominating the numbers, taken them as a model for UK wide results). We have assumed that the distribution of awarded A* to E grades at A level will be very close to the 2019 distribution, with the volumes informed by the change in entries. Reflecting that universities admit students, not individual grades, we have used simulation methods (that have performed well in other years) to estimate what this A level grade distribution would mean in terms of the ‘best three’ A level grades that act as the benchmark for admissions. The results are reported for UK 18 year olds with three A levels we estimate to be in the UCAS system waiting for results.
Awarded grades
Figure 1 Proportion of awarded A level grades at A* or A (2023 estimated)

Figure 1 shows the proportion of A level grades awarded at A or (post 2010) A* level. Different approaches have been taken to grades through time. Prior to 2010 the proportion at higher grades rose steadily, from 2010-2019 the distribution was designed to be more or less fixed. Since 2020 annual moves, each of previously unimaginable magnitude, changed the distribution. First sharp moves upward in grades in the no-exam years of 2020 and 2021, followed by a partial unwinding in 2022. Taking the Ofqual guidance literally, the share of grades at A* and A in 2023 would return to 26 percent. This move, down almost 11 points from 2022, would be the largest ever decline and the second largest move ever (the rise in 2020 taking first place).
Grade profiles for young applicants
Figure 2 Mean A level points for 18 year old applicants (2023 estimated)

The combined grades across the best three A levels gained is key in gaining university places. One useful way to summarise them is as ‘points’, with an A* being 6 points, an A five points and so on, making ‘BBB’ 12 points. Between 2010 and 2019 the average points achieved by UCAS applicants (Figure 2) was in a narrow range between 11.6 and 11.8, so just below BBB.
After the second year of no exams in 2021 that average had risen to 13.4, almost two whole grades higher (so someone who got BBB in 2019 would probably have got AAB in 2021). In 2022 it fell to 12.7. If the awarded grades were to go back to the 2019 distribution, we estimate the average points for applicants for 2023 would fall back to 11.6. This jolt down, 1.1 points, a loss of a whole grade, would be the largest move down recorded for university applicants.
Figure 3 Proportion with high grades, 18 year old applicants (2023 estimated)

The use of average points can understate the scale of the moves at particular grade thresholds. One important grade threshold in the system is getting AAB or better (Figure 3). Historically these have been the grades typically needed to enter the most selective third of universities, and around 31% of A level applicants typically gaining this level. By 2021 over half of these applicants were awarded these grades, falling to 44% in 2022. If the guidelines are followed that proportion would probably fall to 30% or so. That reduction, equivalent to one in seven applicants, would be unprecedented in size.
Figure 4 Predicted and awarded grade profiles for applicants (2023 estimated)

Whilst awarded grades have jumped around in recent years, the predicted grades from teachers have been much more stable. And in the absence of any published data on the distribution this year it seems reasonable to assume they have continued in that vein. Predicted grades are not always fully understood, and are often unfairly poorly regarded as a result. They are a considered estimate from teachers of the likely upper level of (intrinsically variable) awarded grades (that is why they are, on average, higher that what students actually get). They certainly help set applicants aspirations and will have shaped which universities they are holding offers from and the conditions of those offers.
For these reasons, sharp changes in the relationship between predicted and awarded grades will always place stress on the admissions system. Figure 4 shows the numbers predicted and the numbers achieving grades of at least AAB, incorporating our estimate of what taking the Ofqual statements at face value would mean. The numbers predicted higher grades will probably be about the same as 2022 (trend growth in predictions offset by fewer applicants), but those being awarded them would fall.
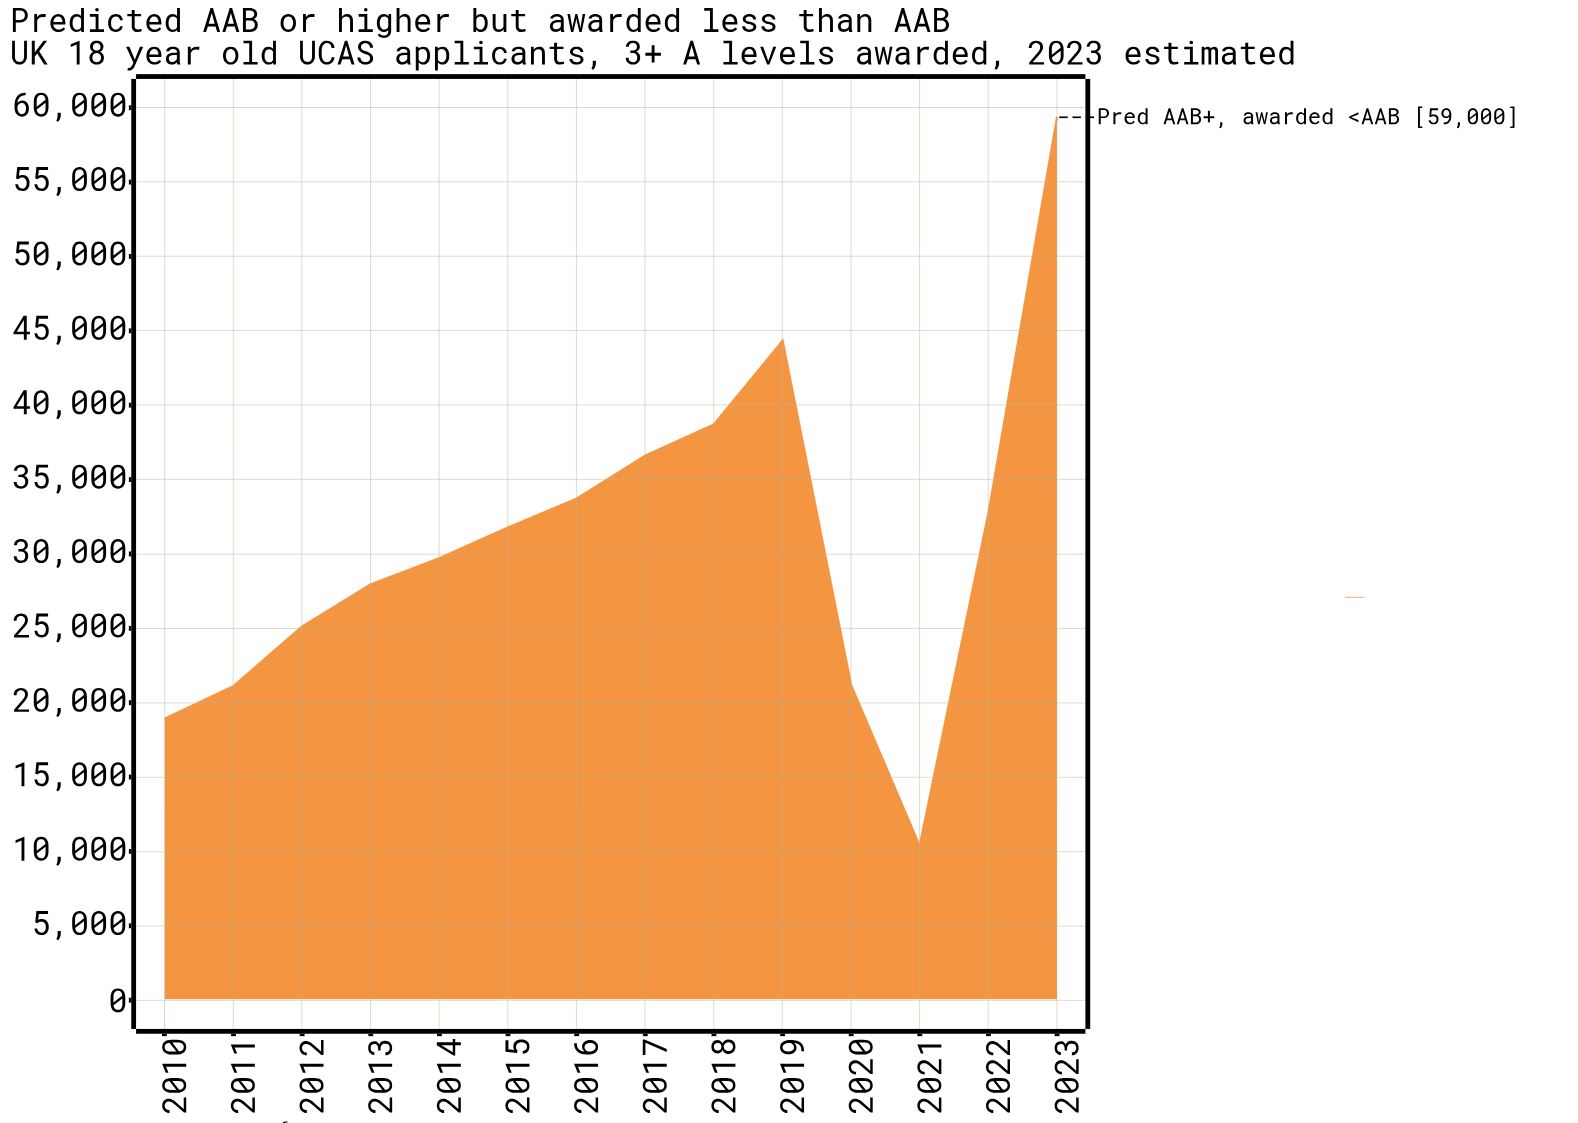
Figure 5 Applicants predicted high grades but not getting them (2023 estimated)

Figure 5 is the more important measure for the stress on the system. It measures the difference between those predicted and those achieving those thresholds. There will always be a difference, but when it changes quickly it causes problems. When awarded grades went up in 2020 and 2021 this meant sharp reductions in those missing their predictions, causing problems for universities honouring offers.
For 2023 falling grades would give the opposite effect, a sharp rise in those anticipating high grades but not getting them. This group would rise to almost 60,000 and the increase, 27,000 in a single year, would be the largest move – in either direction – ever.
In theory changes in the grade distribution should not make any difference to getting into university. People are not becoming more or less able; it is just the ruler is being changed. But in practice both universities and applicants probably find it hard to completely shake off the grade equivalent of the ‘money illusion’, where you focus on the nominal value. It is particularly hard for universities who must confirm 2023 18 year olds, without knowing what the national grade distribution is, and against an unusually large number of 19 year old reapplicants who will have gained their grades from the previous year (and its higher grade distribution).
In recent years that final grade distributions on results day are rarely exactly what people expected from the guidance and this will probably be the case again for 2023. Since going below the 2019 grade distribution (which was itself a bit of a low point) is ruled out, the real falls in grades could well be less than estimated here. But it likely to be a large move down and this can only add to difficulties of an already uncertain admissions cycle. This looks to be especially the case for 18 year old UK applicants, set to see the largest ever drop in grades. Both universities and applicants will be relieved if this fourth year is also the final year of these extraordinary grade movements.
Reference tables
Table 1. 18 year old applicants with A levels, proportions getting specified grade or better (2023 estimated).
UK applicants awarded three or more A levels. Proportion getting these points or better. 2010-2022 from UCAS end of cycle data, 2023 distribution estimated with assumption A level awarded grade profile returns to 2019 pattern. Analysis by dataHE

Table 2. 18 year old applicants with A levels, proportions getting specified grade (2023 estimated).
UK applicants awarded three or more A levels. Proportion getting these points. 2010-2022 from UCAS end of cycle data, 2023 distribution estimated with assumption A level awarded grade profile returns to 2019 pattern. Analysis by dataHE
