
In recent years a consistent feature of undergraduate recruitment to the “higher tariff” group of universities has been a growing share of the intake being overseas students. Is this trend likely to continue this year, and if so what might lie behind it?
Measuring higher fee recruitment for 2022
Recruitment in the 2022 UCAS cycle is not yet over. But the recruitment of young entrants to higher tariff universities (those where students typically have the highest entry qualifications) is largely complete shortly after A level results day (the results disruption of 2020 being an exception). So the UCAS Daily Clearing Analysis data can give a good indication of whether this trend is continuing or not.
The daily data is not as detailed as the End of Cycle outputs and some approximations need to be made. For instance, we have excluding students from Scotland from this analysis (because they mostly attend universities in Scotland, where the different entry qualifications alters how UCAS’ higher tariff grouping works). We have used the latest UCAS data available at this point (one day after A level results day, Friday 19th August 2022).
We divide students into ‘home’ levels of funding (typically the £9,250 fee) or the ‘higher fee’ paid by international students. These higher fees can be much higher. For example, we estimate the figure is around £24,000 for English Russell Group universities this year, about £15,000 higher than their UK peers. Entrants from the EU are included in the ‘home’ category up to 2021, and then counted under the higher fee category for 2021 onwards (this is a slight simplification but will not affect the analysis).
The data for 2022
Recruitment of young entrants to these universities at this point is 100,000, down on the 111,000 recorded at this point last year (Figure 1), though intakes remain much higher than a decade ago. Most young entrants are paying home fees.
Figure 1 Young entrants to higher tariff universities by fee type

Recruitment of home fee 18 year olds in 2022 is down 12,000 (-13%) to just under 80,000, despite high demand. In contrast, the intake of higher fee students has risen by 1,400 (+7%). It now sits at over 20,000 for the first time (Figure 2), having risen at a faster rate than home students (at this point) every single year since 2012.
Figure 2 Young entrants to higher tariff universities paying higher fees

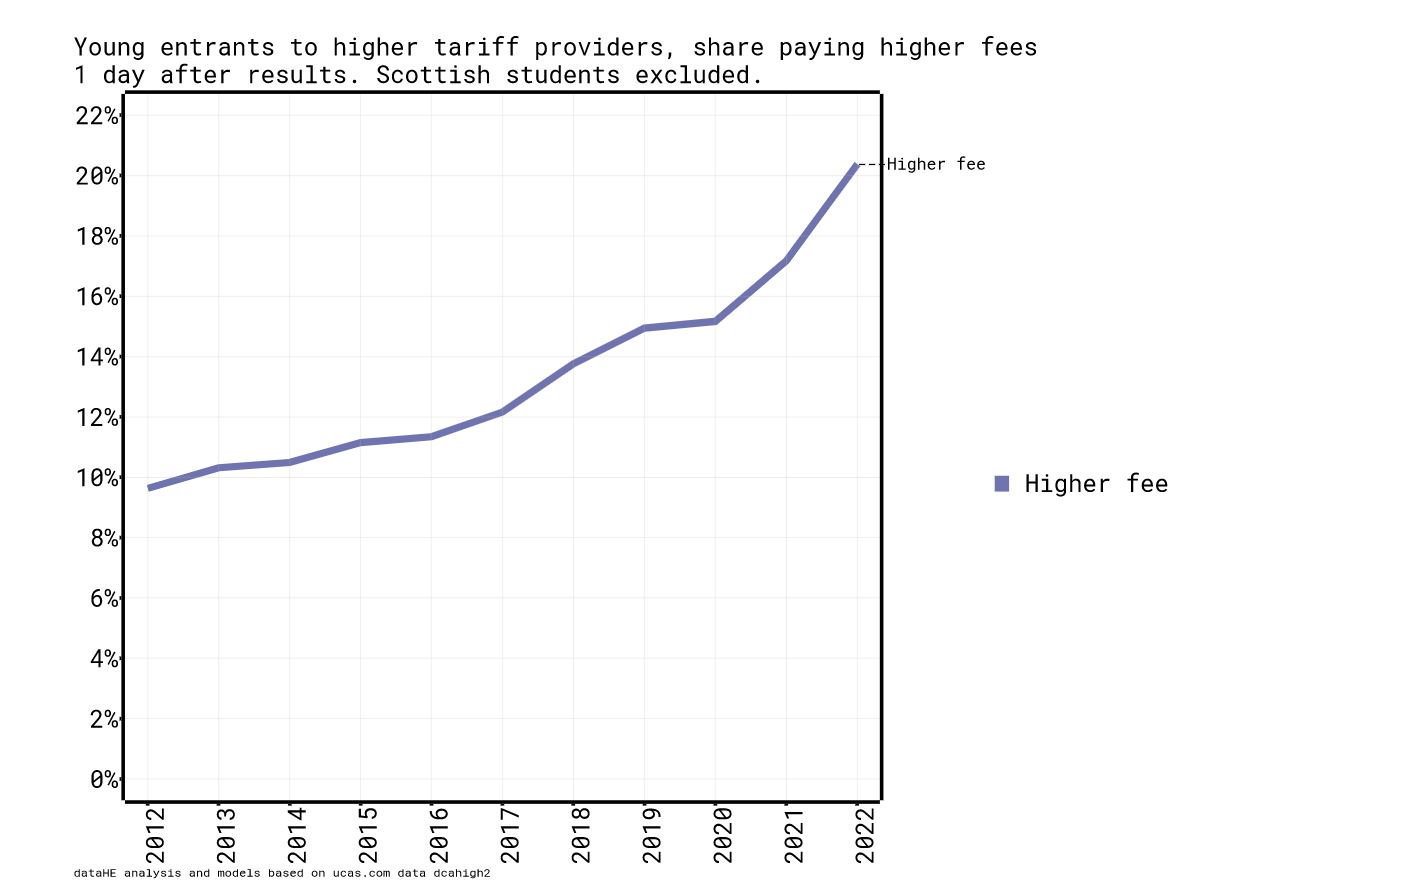
These diverging moves have pushed the share of entrants who will be paying higher fees (Figure 3) this Autumn to a record 20%, twice the level of 2012.
Figure 3 Share of young entrants to higher tariff universities paying higher fees

Tuition fees for UK students
Universities value overseas students for the international perspectives they bring to campus. That higher tariff universities (who attract the bulk of these higher fee students) can grow recruitment numbers at this pace whilst charging around £24,000 indicates the high market value of UK HE. But the rising share of overseas students may well simply reflect the increasingly threadbare economics of teaching UK students.
If the £9,000 fee introduced in 2012 had kept pace with inflation it would need to be over £12,000 this Autumn. It is instead £9,250. University costs are difficult to work out, but these universities have never run at much of a margin, so probably do now need around £12,000 to provide high quality teaching. It will vary university to university, but a £3,000 funding gap for UK students is not entirely unreasonable.
The calculations that universities are then forced into might run like this: £24,000 income from a higher fee student; subtract £12,000 teaching costs leaves £12,000; enough to bridge the £3,000 fee gap for four UK students. This would imply you need around 20% of your intake to be paying higher fees this year. This is in territory of what the data shows for these universities that can readily attract higher fee students. If similar calculations are driving recruitment numbers then it is clear that a cap on international students would simply be a cap on UK students too. The underlying problem is the inflation-ravaged UK tuition fee.
The current funding arrangements likely force universities into reserving ever larger shares of their capacity for students from overseas. Regardless of the strength of domestic demand or the merit in serving it. Policy makers have grown wary of making substantial changes to the system of tuition fees and university funding. But with signs growing in the data this year of faltering supply in the face of high demand it may not be avoidable for much longer.
Reference table
Table 1 Reference table. Young UCAS entrants to higher tariff universities at one day after A level results
Numbers and share of young entrants to higher tariff universities by home/higher fee status. One day after A level results. Young=aged 17 or 18. UCAS applicants from England, Northern Ireland, Wales, EU and Not EU. Scotland excluded. UK Higher Tariff (typical higher entry qualifications held by students) universities. Higher fee=Not EU (always), EU (2021 onwards). UCAS daily clearing analysis data . Analysis by dataHE.uk
| Fee group | ||||||||
|---|---|---|---|---|---|---|---|---|
| 1. Home fee | 2. Higher fee | |||||||
| Placed | Change from last year | Change from last year % | Share of entrants | Placed | Change from last year | Change from last year % | Share of entrants | |
| Sum | Sum | Sum | Sum | Sum | Sum | Sum | Sum | |
| UCAS cycle | ||||||||
| 2012 | 61,550 | . | . | 90.4% | 6,560 | . | . | 9.6% |
| 2013 | 65,030 | 3,480 | 5.7% | 89.7% | 7,480 | 920 | 14.0% | 10.3% |
| 2014 | 66,320 | 1,290 | 2.0% | 89.5% | 7,770 | 290 | 3.9% | 10.5% |
| 2015 | 70,700 | 4,380 | 6.6% | 88.9% | 8,870 | 1,100 | 14.2% | 11.1% |
| 2016 | 72,850 | 2,150 | 3.0% | 88.7% | 9,320 | 450 | 5.1% | 11.3% |
| 2017 | 74,030 | 1,180 | 1.6% | 87.8% | 10,250 | 930 | 10.0% | 12.2% |
| 2018 | 73,350 | -680 | -0.9% | 86.2% | 11,700 | 1,450 | 14.1% | 13.8% |
| 2019 | 73,480 | 130 | 0.2% | 85.1% | 12,910 | 1,210 | 10.3% | 14.9% |
| 2020 | 78,830 | 5,350 | 7.3% | 84.8% | 14,090 | 1,180 | 9.1% | 15.2% |
| 2021 | 91,810 | 12,980 | 16.5% | 82.8% | 19,040 | 4,950 | 35.1% | 17.2% |
| 2022 | 79,720 | -12,090 | -13.2% | 79.6% | 20,400 | 1,360 | 7.1% | 20.4% |